Last updated: August 13, 2026
Sooner or later every indoor grower goes looking for the same thing: one page with the numbers on it. What pH does lettuce want, how strong should a tomato reservoir be, and is basil closer to a leafy green or a fruiting crop? A hydroponic nutrients chart answers all three at a glance, which is why the printed version ends up taped inside a cabinet door in a lot of grow spaces.
Below is that page. It gives pH, EC, and parts per million ranges for the crops most people actually grow indoors, plus the stage adjustments that matter more than the crop row itself. Read the short explainer under the chart before you use it, because these are commonly cited starting ranges rather than fixed rules, and published charts disagree with each other more than beginners expect.
This article contains affiliate links. If you buy through them, we may earn a commission at no extra cost to you. Learn more.
Quick Answer
What pH and EC should my hydroponic crop run at?
- Most indoor crops sit somewhere around pH 5.5 to 6.5, with leafy greens toward the lower half and a few herbs and brassicas happier nearer 6.5.
- Strength climbs with the crop: leafy greens typically around 0.8 to 1.4 EC, herbs around 1.0 to 2.2, and fruiting crops like tomatoes commonly 2.0 to 3.5.
- Seedlings always start lower, usually around a quarter to half of the mature target, and work up as real leaves appear.
The Hydroponic Nutrient Chart
Here are the commonly published ranges for pH, EC in millisiemens per centimeter, and ppm on the 500 scale, which is what most meters sold in the United States display. If your meter uses the 700 scale, the ppm numbers below will read noticeably higher on the same solution.
| Crop | pH range | EC (mS/cm) | PPM (500 scale) |
|---|---|---|---|
| Lettuce | 5.5 to 6.5 | 0.8 to 1.2 | 400 to 600 |
| Spinach | 5.5 to 6.6 | 1.8 to 2.3 | 900 to 1150 |
| Kale | 5.5 to 6.5 | 1.2 to 1.8 | 600 to 900 |
| Arugula | 6.0 to 7.0 | 0.8 to 1.2 | 400 to 600 |
| Swiss chard | 6.0 to 6.5 | 1.8 to 2.3 | 900 to 1150 |
| Bok choy | 6.0 to 7.0 | 1.5 to 2.5 | 750 to 1250 |
| Microgreens | 5.5 to 6.5 | 0.5 to 1.2 | 250 to 600 |
| Basil | 5.5 to 6.5 | 1.0 to 1.6 | 500 to 800 |
| Mint | 5.5 to 6.0 | 2.0 to 2.4 | 1000 to 1200 |
| Parsley | 5.5 to 6.0 | 1.8 to 2.2 | 900 to 1100 |
| Cilantro | 6.5 to 6.7 | 1.2 to 1.8 | 600 to 900 |
| Chives | 6.0 to 6.5 | 1.8 to 2.4 | 900 to 1200 |
| Strawberries | 5.5 to 6.5 | 1.0 to 1.8 | 500 to 900 |
| Tomatoes | 5.5 to 6.5 | 2.0 to 3.5 | 1000 to 1750 |
| Peppers | 5.5 to 6.5 | 1.8 to 2.8 | 900 to 1400 |
| Cucumbers | 5.5 to 6.0 | 1.7 to 2.5 | 850 to 1250 |
| Green beans | 6.0 to 6.5 | 2.0 to 4.0 | 1000 to 2000 |
| Celery | 6.3 to 6.7 | 1.8 to 2.4 | 900 to 1200 |
| Broccoli | 6.0 to 6.8 | 2.8 to 3.5 | 1400 to 1750 |
Print this page, or screenshot the table and keep it on your phone. If the ppm column looks unfamiliar, our guide to EC and PPM in hydroponics explains why two meters can read the same reservoir differently.
How to Read the Chart Without Getting Burned
Treat every row as a comfortable neighborhood, not an address. Plants do not fail at 6.6 and thrive at 6.5. What actually matters is staying inside the range most of the time and avoiding long stretches at the extremes, where specific nutrients become harder for roots to take up.
The reason published charts disagree is that they come from different growing contexts: commercial greenhouses, university trials, hobby forums, and manufacturer labels all optimize for different things. A commercial lettuce grower chasing yield per square foot runs a tighter target than someone growing four heads on a windowsill. When two sources conflict, the safer move is the middle of the overlap, and the safest habit is changing one variable at a time.
pH decides availability, EC decides quantity
These two numbers answer different questions. pH determines which nutrients your roots can actually absorb from the solution: push above roughly 6.5 and iron, manganese, and other micronutrients get harder to take up, which is why yellowing between the veins of new leaves is such a common high-pH symptom. Drop below about 5.0 and calcium and magnesium uptake suffers instead. EC tells you how much dissolved mineral is in the water in total, but says nothing about the balance between elements. Both are covered in more depth in our hydroponic nutrients explainer.
Stage Adjustments Matter More Than the Crop Row
A tomato seedling and a fruiting tomato plant want completely different solutions, and the gap between those two states is wider than the gap between most crops on the chart. Feed by stage first, then fine-tune to the crop.
| Stage | Typical EC | What is happening |
|---|---|---|
| Seedlings and fresh cuttings | 0.4 to 0.8 | Tiny root systems burn easily; plain water or a very weak solution is normal for the first week or two |
| Young transplants | Around half the mature target | Roots are establishing; step up gradually as true leaves appear |
| Vegetative growth | Full target for the crop | Nitrogen demand peaks; leafy crops stay here for the whole cycle |
| Flowering and fruiting | Upper end of the crop range | Potassium, calcium, and magnesium demand rises as fruit sets and fills |
Two conditions push the whole picture up or down. Strong light and warm rooms make plants transpire faster, so they drink water quicker than they take up minerals and the reservoir concentrates; many growers run slightly weaker in summer for exactly this reason. Cool, dim conditions do the opposite. Our guide to nutrient dosing per crop works through those adjustments in practice.
Using the Chart in a Weekly Routine
The chart is only useful if it turns into a habit. A workable routine takes about five minutes a week and catches nearly every problem before it becomes visible on the leaves.
- Mix to the crop target. Add nutrients to water, never the other way around, then stir and let it settle for a few minutes before measuring.
- Check EC first. Adjust strength with plain water or more nutrient until you land in the crop range.
- Check pH second. Nutrients shift pH, so measuring before they are fully dissolved wastes adjustment solution.
- Top up with plain water midweek. Rising EC between checks usually means the plant is drinking water faster than minerals, so plain water is the correction.
- Change the reservoir on schedule. Ratios drift even when the total number looks right, which is why full changes beat endless topping up.
Accuracy depends entirely on your meters, and cheap uncalibrated testers cause more confusion than they solve. Our roundup of the best pH meters for hydroponics covers the models growers keep recommending, and the mixing order itself is detailed in how to mix hydroponic nutrients. Since meters, pumps, and lights all live near open water, keep everything on a GFCI outlet with a drip loop in the cord.
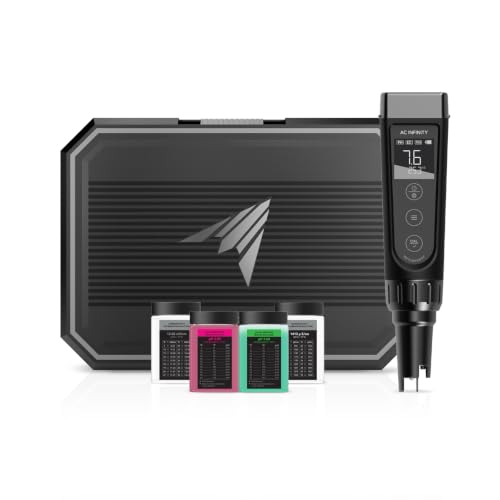
For a weekly check like this one, a combination pen that reads pH and EC in the same dip keeps the whole routine to a single tool:
Common Mistakes to Avoid
- Chasing decimals. Correcting pH from 6.1 to 6.0 does nothing except use up pH Down. React to trends, not to single readings.
- Comparing ppm numbers from different scales. A forum post saying 800 ppm may mean two different strengths depending on the meter. Convert to EC before you compare.
- Feeding seedlings at mature strength. The single most common way to stall a new grow. Start weak.
- Adjusting pH before the nutrients dissolve. The reading will move again once they do, and you will end up overcorrecting.
- Ignoring your tap water. Hard water already carries dissolved minerals, so your starting EC is not zero. Measure the plain water first and subtract.
Where to Go From Here
If you grow one crop far more than the others, the crop-specific guides go deeper than any chart can. Lettuce growers should read pH for hydroponic lettuce, since holding a stable pH is most of the battle in a small reservoir, and basil growers will find the feeding curve in our hydroponic nutrients for basil guide.
If the numbers still feel abstract, grow something forgiving first. Lettuce in a simple passive setup will tolerate a wide pH swing and still give you a harvest, and one completed crop teaches more about reading a reservoir than a month of reading charts.
Frequently Asked Questions
What is the best pH for hydroponics overall? If you grow mixed crops in one reservoir, most growers settle around 5.8 to 6.2. That window keeps both micronutrients and calcium reasonably available, which is the usual compromise for a shared system.
Why do hydroponic charts disagree with each other? They come from different contexts: commercial trials, hobby forums, and nutrient labels all optimize for different goals. When sources conflict, aim for the middle of the overlap and adjust based on how your plants respond.
Should I match EC or ppm? Work in EC where you can, because it is a single physical measurement. PPM depends on which conversion scale your meter uses, so the same solution can read 500 or 700 ppm depending on the device.
Do I need to lower EC in hot weather? Often yes. Plants transpire more in warm, bright conditions and drink water faster than they take up minerals, so the reservoir concentrates. Many growers run slightly weaker in summer and top up with plain water.
Does the chart apply to smart gardens with pods? Roughly, but countertop gardens are designed around their own liquid plant food and dosing schedule. Follow the manufacturer instructions first and use the chart to understand what those doses are aiming for.
The Bottom Line
Use the chart as a starting point, not a verdict: leafy greens low and lean, herbs in the middle, fruiting crops strong and toward the upper end of their range. Adjust for stage before you adjust for crop, since a seedling and a fruiting plant are further apart than lettuce and tomatoes. Then measure weekly, change one thing at a time, and let the plants confirm the numbers.